


Infographics
While number crunching and medical jargon may be second nature to medical professionals and scientists, explaining complex data and unfamiliar concepts to the end consumer can be a daunting challenge.
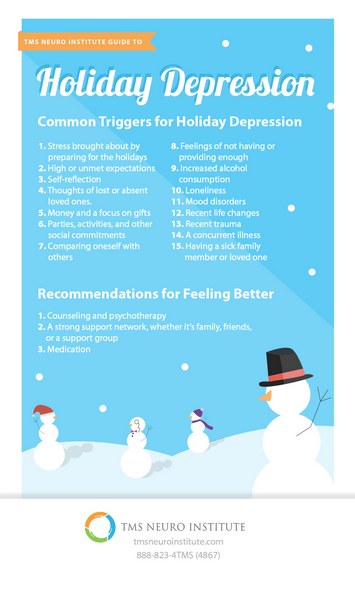
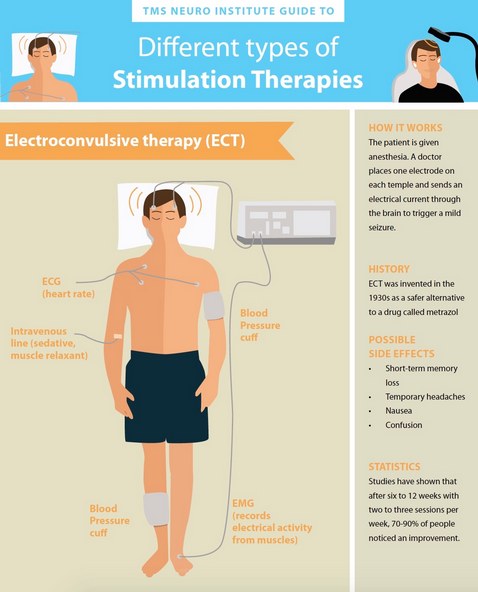
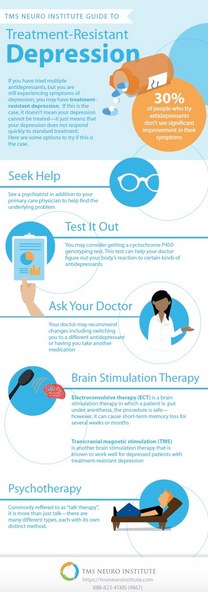
At Quaintise, we create award-winning infographics that allow consumers to easily digest information through the use of visual data, charts, and statistics. Infographics are a clear, effective means of presenting information without losing the attention of your audience.
In the medical and life sciences industries, there is no shortage of data that needs to be analyzed and reported. Through the use of infographics, complex numbers, detailed statistics, and dense information can be transformed into memorable, attention-grabbing, and persuasive visuals.
Infographics can be repurposed on multiple platforms, including your website, social media pages, and print marketing materials. The following are the most popular types of infographics our medical marketing firm develops and implements for our client base:
- Statistical infographics
- Informational infographics
- Timeline infographics
- Process infographics
- Geographic infographics
- Comparison infographics
- Hierarchical infographics
- List infographics